Showing posts with label Meteorology. Show all posts

Wednesday, August 1, 2012

Moon Phase


moon_phases_diagram

The Moon exhibits different phases as the relative position of the Sun, Earth and Moon changes, appearing as a full moon when the Sun and Moon are on opposite sides of the Earth and as a new moon (dark moon) when they are on the same side. The phases of full moon and new moon are examples of syzygies, which occur when the Earth, Moon, and Sun lie (approximately) in a straight line. The time between two full moons (a Lunar month) is about 29.53 days (29 days, 12 hours, 44 minutes 2.8 seconds) on average (hence, the concept of the time frame of an approximated month was derived). This Synodic month is longer than the time it takes the Moon to make one orbit around the Earth with respect to the fixed stars (the Sidereal month), which is about 27.32 days (27 days, 7 hours, 43 minutes 11.5 seconds).This difference is caused by the fact that the Earth-Moon system is orbiting around the Sun at the same time the Moon is orbiting around the Earth.
The orbit of the moon  is very nearly circular (eccentricity 0.05) with a mean separation from the earth of about 384,000 km. which is about 60 earth radii. The plane of the orbit is tilted about 5 degrees with respect to the plane.
moon-8

Moonphases

moon-phases-101111-02

Priming -  New Moon to 1st Quarter (1-3) / Full Moon to 3rd Quarter (5-7)
Lagging – 1st Quarter to Full Moon (3-5) / 3rd Quarter to New Moon (7-1)
Waxing Moon – The Moon between new and full when its visible part is increasing.
Waning Moon – The moon between full and new and when its visible part is decreasing.
Harvest Moon – The full moon nearest  the autumnal equinox.
Hunters Moon – The full moon one month after the autumnal equinox.
Neap Tides (1st Quarter or 3rd Quarter)
Spring Tides  (New Moon and Full Moon)
Position
Phase
Age (days)
Rise
1 New Moon 0 6 AM
2 1st Quarter 7 1/4 12 NN
3 Full Moon 14 1/2 18 PM
4 3rd Quarter 21 3/4 24 PM
moonphases

Beaufort Wind Scale

Your Guide to Seafaring

The Beaufort Wind Scale is an empirical measure that relates wind speed to observed conditions at sea or on land1. Developed in 1805 by Sir Francis Beaufort, a British Royal Navy officer, the scale has been an essential tool for mariners, meteorologists, and various fields beyond since its inception2.

Historical Background

Sir Francis Beaufort devised the scale while serving on HMS Woolwich1. Initially, the scale was based on the effects of wind on a ship's sails, ranging from "just sufficient to give steerage" to "that which no canvas sails could withstand."1 Over time, the scale was refined and extended to include land observations, making it more versatile and widely applicable1.

Beaufort

Number

Speed(kn)

Speed (mph)

Speed (km/h)

Description

Wave Height (meters)

0

0-1

0-1

0-1

Calm

Sea like a mirror

1

1-3

1-3

1-3

Light Air

Sea with ripples

2

4-6

4-7

4-6

Light Breeze

Small wavelets

3

7-10

8-12

7-10

Gentle Breeze

Large wavelets

4

11-16

13-18

11-16

Moderate Breeze

Small waves

5

17-21

19-24

17-21

Fresh Breeze

Moderate waves

6

22-27

25-31

22-27

Strong Breeze

Large waves

7

28-33

32-38

28-33

Near Gale

High waves

8

34-40

39-46

34-40

Gale

Very high waves

9

41-47

47-54

41-47

Severe Gale

High waves

10

48-55

55-63

48-55

Storm

Very high waves

11

56-63

64-72

56-63

Violent Storm

Exceptionally high waves

12

64+

73+

64+

Hurricane

Devastation


Modern Scale

The Beaufort Wind Scale is divided into 13 levels, ranging from 0 (calm) to 12 (hurricane force)1. Each level is associated with specific wind speeds, observed conditions, and probable wave heights3. Here's a detailed breakdown:

Functions and Applications

The Beaufort Wind Scale is widely used in maritime navigation, weather forecasting, and environmental monitoring1. It helps mariners assess wind conditions and make informed decisions to ensure safe navigation. Meteorologists use the scale to describe wind conditions in weather reports, and it is also used in various industries to assess the impact of wind on structures and activities.

Conclusion

The Beaufort Wind Scale remains a valuable tool for understanding and communicating wind conditions. Its simplicity and practicality have made it a staple in maritime and meteorological practices for over two centuries. By providing a standardized way to measure and describe wind speeds, the Beaufort Wind Scale continues to play a crucial role in ensuring safety and efficiency in various fields.


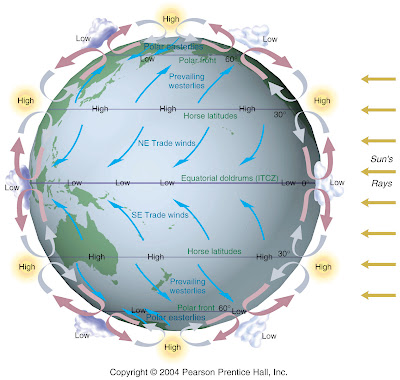
Wind Circulation


               circ

Around the equator there is a belt of relatively low pressure known as the doldrums, where the heated air is expanding and rising; at about lat. 30°N and S there are belts of high pressure known as the horse latitudes, regions of descending air; farther poleward, near lat. 60°N and S, are belts of low pressure, where the polar front is located and cyclonic activity is at a maximum; finally there are the polar caps of high pressure.

The prevailing wind systems of the earth blow from the several belts of high pressure toward adjacent low-pressure belts. Because of the earth's rotation (see Coriolis effect), the winds do not blow directly northward or southward to the area of lower pressure, but are deflected to the right in the Northern Hemisphere and to the left in the Southern Hemisphere. The wind systems comprise the trade winds; the prevailing westerlies, moving outward from the poleward sides of the horse-latitude belts toward the 60° latitude belts of low pressure (from the southwest in the Northern Hemisphere and from the northwest in the Southern Hemisphere); and the polar easterlies, blowing outward from the polar caps of high pressure and toward the 60° latitude belts of low pressure.

These are your Keywords:

Doldrums (5°N to 5°S)
Diurnal pressure variation is most noticeable. Low Pressure belt near the Equator.

Trade Winds (5° - 30° N/S)
Greatest Effect on set, drift, depth of equatorial currents. Fine clear Weather.

Horse Latitudes (30° - 35° N/S)
Diurnal pressure variation is commonly observe. Region of high pressure extending around earth 35°. Pole side of trade winds belt area of high pressure.


Types Of Clouds


T_38298

Cloud Types

Most clouds are associated with weather. These clouds can be divided into groups mainly based on the height of the cloud's base above the Earth's surface. The following table provides information about cloud groups and any cloud classes associated with them. In addition, some clouds don't fall into the categories by height. These additional cloud groups are listed below the high, middle, and low cloud groups.


High-Level Clouds High-level clouds form above 20,000 feet (6,000 meters) and since the temperatures are so cold at such high elevations, these clouds are primarily composed of ice crystals. High-level clouds are typically thin and white in appearance, but can appear in a magnificent array of colors when the sun is low on the horizon.

Cirrus

Cirrus clouds are the most common of the High Cloud (5000-13000m) group. They are composed entirely of ice and consist of long, thin, wispy streamers. They are commonly known as "mare's tails" because of their appearance.
Cirrus clouds are usually white and predict fair weather.

Cirrocumulus

Cirrocumulus clouds belong to the High Cloud group (5000-13000m). They are small rounded puffs that usually appear in long rows. Cirrocumulus are usually white, but sometimes appear gray. Cirrocumulus clouds are the same size or smaller than the width of your littlest finger when you hold up your hand at arm's length.
If these clouds cover a lot of the sky, it is called a "mackerel sky" because the sky looks like the scales of a fish. Cirrocumulus are usually seen in the winter time and indicate fair, but cold weather.

Cirrostratus

Cirrostratus clouds belong to the High Cloud (5000-13000m) group. They are sheetlike thin clouds that usually cover the entire sky.
The sun or moon can shine through cirrostratus clouds . Sometimes, the sun or moon will appear to have a halo around it when in the presence of cirrostratus. The ice crystals from the cloud refracts the light from the sun or moon, creating a halo. This halo is the width of your hand when you hold it out at arm's length.
Cirrostratus clouds usually come 12-24 hours before a rain or snow storm. This is especially true if Middle group clouds are associated with it.


Mid-Level Clouds The bases of mid-level clouds typically appear between 6,500 to 20,000 feet (2,000 to 6,000 meters). Because of their lower altitudes, they are composed primarily of water droplets, however, they can also be composed of ice crystals when temperatures are cold enough.

Altocumulus

Altocumulus clouds are part of the Middle Cloud group (2000-7000m up). They are grayish-white with one part of the cloud darker than the other. Altocumulus clouds usually form in groups and are about 1 km thick.
Altocumulus clouds are about as wide as your thumb when you hold up your hand at arm's length to look at the cloud.
If you see altocumulus clouds on a warm humid morning, then expect thunderstorms by late afternoon.

Altostratus

Altostratus belong to the Middle Cloud group (2000-7000m up). An altostratus cloud usually covers the whole sky and has a gray or blue-gray appearance. The sun or moon may shine through an altostratus cloud, but will appear watery or fuzzy.
An altostratus cloud usually forms ahead of storms with continuous rain or snow. Occasionally, rain will fall from an altostratus cloud. If the rain hits the ground, then the cloud becomes classified as a nimbostratus cloud.


Low-level Clouds Low clouds are of mostly composed of water droplets since their bases generally lie below 6,500 feet (2,000 meters). However, when temperatures are cold enough, these clouds may also contain ice particles and snow.


Stratus

Stratus clouds belong to the Low Cloud (surface-2000m up) group. They are uniform gray in color and can cover most or all of the sky. Stratus clouds can look like a fog that doesn't reach the ground.
Light mist or drizzle is sometimes associated with stratus clouds.

Stratocumulus

Stratocumulus clouds belong to the Low Cloud (surface-2000m) group. These clouds are low, lumpy, and gray. These clouds can look like cells under a microscope - sometimes they line up in rows and other times they spread out.
Only light precipitation, generally in the form of drizzle, occurs with stratocumulus clouds. To distinguish between a stratocumulus and an altocumulus cloud, point your hand toward the cloud. If the cloud is about the size of your fist, then it is stratocumulus.

Nimbostratus

Nimbostratus clouds belong to the Low Cloud (surface to 2000m up) group. They are dark gray with a ragged base. Nimbostratus clouds are associated with continuous rain or snow. Sometimes they cover the whole sky and you can't see the edges of the cloud.

Cumulonimbus

Cumulonimbus clouds belong to the Clouds with Vertical Growth group. They are generally known as thunderstorm clouds. A cumulonimbus cloud can grow up to 10km high. At this height, high winds will flatten the top of the cloud out into an anvil-like shape. Cumulonimbus clouds are associated with heavy rain, snow, hail, lightning, and tornadoes.

Cumulus

Cumulus clouds belong to the Clouds with Vertical Growth group. They are puffy white or light gray clouds that look like floating cotton balls. Cumulus clouds have sharp outlines and a flat base. Cumulus clouds generally have a base height of 1000m and a width of 1km.
Cumulus clouds can be associated with good or bad weather. Cumulus humilis clouds are associated with fair weather. Cumulus congestus clouds are usually associated with bad weather. Their tops look like cauliflower heads and mean that light to heavy showers can occur.
Here's a tip on how to know if you see a cumulus cloud in the sky. Cumulus cloud cells (the individual puffs of clouds) are about the size of your fist or larger when you hold up your hand at arm's length to look at the cloud.